Implementing the example in the “Overcoming Bias” paper by Fornasier et al. (2022) (arxiv version). This notebook was created by converting Alessandro Fornasier’s equivariant filter code to use GTSAM’s built-in data structures.
Authors: Jennifer Oum & Darshan Rajasekaran

import numpy as np
import pandas as pd
import progressbar
import pandas as pd
import matplotlib.pyplot as plt
import math

import gtsam
from gtsam import findExampleDataFile, Rot3

from EqF import *
def formatCSV(df): # pass the dataframe in to this function and get "data_list" as an output
"""Read data from csv file formatted as follows:
| -------------------------------------------------------------------------------------------- |
| t: time |
| -------------------------------------------------------------------------------------------- |
| q_x, q_y, q_z, q_w: Quaternion representing the attitude |
| -------------------------------------------------------------------------------------------- |
| b_x, b_y, b_z: Gyro bias |
| -------------------------------------------------------------------------------------------- |
| cq_x_0, cq_yv, cq_z_0, cq_w_0: Quaternion representing the first calibration |
| ... |
| cq_x_n, cq_y_n, cq_z_n, cq_w_n: Quaternion representing the last calibration |
| -------------------------------------------------------------------------------------------- |
| w_x, w_y, w_z: Gyro measurements |
| -------------------------------------------------------------------------------------------- |
| std_w_x, std_w_x, std_w_z: Gyro measurements noise standard deviation |
| -------------------------------------------------------------------------------------------- |
| std_b_x, std_b_x, std_b_z: Gyro bias random walk standard deviation |
| -------------------------------------------------------------------------------------------- |
| y_x_0, y_y_0, y_z_0: Direction measurement in sensor frame associated to calibration state 0 |
| ... |
| y_x_n, y_y_n, y_z_n: Direction measurement in sensor frame associated to calibration state n |
| y_x_n+1, y_y_n+1, y_z_n+1: Direction measurement in sensor frame from calibrated sensor |
| ... |
| y_x_m, y_y_m, y_z_m: Direction measurement in sensor frame from calibrated sensor |
| -------------------------------------------------------------------------------------------- |
| std_y_x_0, std_y_y_0, std_y_z_0: Standard deviation of direction measurement y_0 |
| ... |
| std_y_x_m, std_y_y_m, std_y_z_m: Standard deviation of direction measurement y_m |
| -------------------------------------------------------------------------------------------- |
| d_x_0, d_y_0, d_z_0: Known direction in global frame associated to direction measurement 0 |
| ... |
| d_x_m, d_y_m, d_z_m: Known direction in global frame associated to direction measurement m |
| -------------------------------------------------------------------------------------------- |
NaN cell means that value is not present at that time
Max allowd n = 5
Max allowd m = 10
:param pname: path name
"""
# read .csv file into pandas dataframe
df = df.reset_index()
# Define data_list as list
data_list = []
last_timestamp = df.t[0]
# Check for existence of bias ground-truth into loaded data
bias_exist = False
if {'b_x', 'b_y', 'b_z'}.issubset(df.columns):
bias_exist = True
# Check for existence of calibration ground-truth (yaw, pitch, roll angles) into loaded data
cal_exist = False
n_cal = 0
for i in range(6):
if {'cq_x_' + str(i), 'cq_y_' + str(i), 'cq_z_' + str(i), 'cq_w_' + str(i)}.issubset(df.columns):
cal_exist = True
n_cal = i+1
# Check for existence of direction measurements
n_meas = 0
for i in range(11):
if {'y_x_' + str(i), 'y_y_' + str(i), 'y_z_' + str(i)}.issubset(df.columns):
n_meas = i + 1
for index, row in df.iterrows():
# Load timestamps and record dt
t = float(row['t'])
dt = t - last_timestamp
# Skip data_list if dt is smaller than a micro second
if dt < 1e-6:
continue
last_timestamp = t
# Load groundtruth values
quat = np.array([float(row['q_x']), float(row['q_y']), float(row['q_z']), float(row['q_w'])])
R = Rot3(gtsam.Rot3.Quaternion(float(row['q_w']), float(row['q_x']), float(row['q_y']), float(row['q_z'])).matrix())
# Load Gyro biases
if bias_exist:
b = np.array([float(row['b_x']), float(row['b_y']), float(row['b_z'])]).reshape(3,)
else:
b = np.zeros(3)
# Load GNSS calibration
S = []
if cal_exist:
for i in range(n_cal):
cal = np.array([float(row['cq_x_' + str(i)]), float(row['cq_y_' + str(i)]), float(row['cq_z_' + str(i)]), float(row['cq_w_' + str(i)])])
S.append(Rot3(gtsam.Rot3.Quaternion(float(row['cq_w_' + str(i)]), float(row['cq_x_' + str(i)]), float(row['cq_y_' + str(i)]), float(row['cq_z_' + str(i)])).matrix()))
# Load Gyro inputs
w = np.array([float(row['w_x']), float(row['w_y']), float(row['w_z'])]).reshape(3,)
std_w = np.array([float(row['std_w_x']), float(row['std_w_y']), float(row['std_w_z'])]).reshape(3,)
std_b = np.array([float(row['std_b_x']), float(row['std_b_y']), float(row['std_b_z'])]).reshape(3,)
Sigma_wb = blockDiag(np.eye(3) * (std_w ** 2), np.eye(3) * (std_b ** 2))
# Load measurements
meas = []
for i in range(n_meas):
y = np.array([float(row['y_x_' + str(i)]), float(row['y_y_' + str(i)]), float(row['y_z_' + str(i)])]).reshape(3,)
d = np.array([float(row['d_x_' + str(i)]), float(row['d_y_' + str(i)]), float(row['d_z_' + str(i)])]).reshape(3,)
std_y = np.array([float(row['std_y_x_' + str(i)]), float(row['std_y_y_' + str(i)]), float(row['std_y_z_' + str(i)])]).reshape(3,)
if i < n_cal:
meas.append(Measurement(y, d, np.eye(3) * (std_y ** 2), i))
else:
meas.append(Measurement(y, d, np.eye(3) * (std_y ** 2), -1))
# Append to data_list
d = Data(State(R, b, S), n_cal, Input(w, Sigma_wb), meas, n_meas, t, dt)
data_list.append(d)
return data_listdef sim(filter_args, data):
# Define progressbar
p = progressbar.ProgressBar()
# EqF
filter = EqF(*filter_args)
# Allocate variables
t = []
est = []
# Filter loop
for d in p(data):
t.append(d.t)
# Run filter
try:
filter.propagation(d.u, d.dt)
except:
print('Filter.propagation Error\n')
for y in d.y:
if not (np.isnan(np.linalg.norm(y.y.d.unitVector())) or np.isnan(np.linalg.norm(y.d.d.unitVector()))):
try:
filter.update(y)
except:
print('Filter.update Error\n')
est.append(filter.stateEstimate())
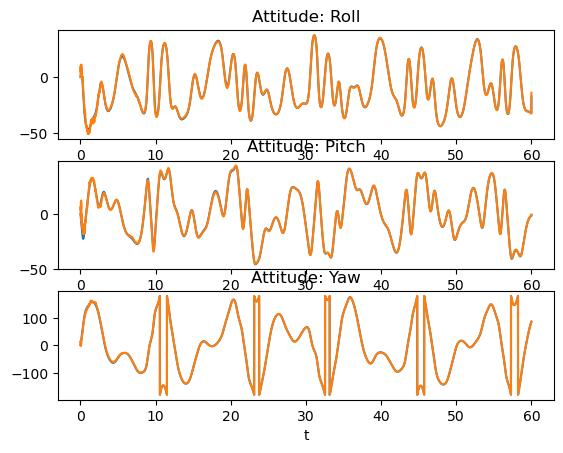
# Plot Attitude1
fig, (ax0, ax1, ax2) = plt.subplots(3, 1)
ax = [ax0, ax1, ax2]
for i in range(3):
ax[i].plot(t, [d.xi.R.rpy()[i] * 180 / math.pi for d in data], color="C0")
ax[i].plot(t, [xi.R.rpy()[i] * 180 / math.pi for xi in est], color="C1")
ax[i].set_xlabel("t")
ax0.set_title("Attitude: Roll")
ax1.set_title("Attitude: Pitch")
ax2.set_title("Attitude: Yaw")
plt.show()
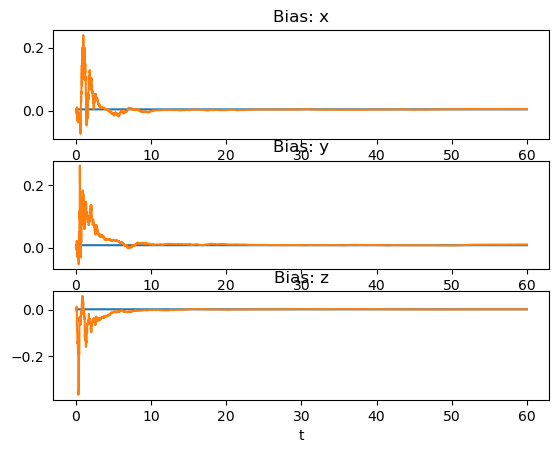
# Plot bias
fig, (ax0, ax1, ax2) = plt.subplots(3, 1)
ax = [ax0, ax1, ax2]
for i in range(3):
ax[i].plot(t, [d.xi.b[i] for d in data], color="C0")
ax[i].plot(t, [xi.b[i] for xi in est], color="C1")
ax[i].set_xlabel("t")
ax0.set_title("Bias: x")
ax1.set_title("Bias: y")
ax2.set_title("Bias: z")
plt.show()
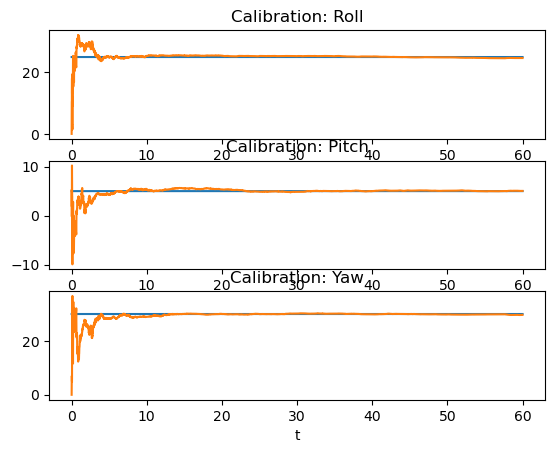
# Plot calibration states
for j in range(data[0].n_cal):
fig, (ax0, ax1, ax2) = plt.subplots(3, 1)
ax = [ax0, ax1, ax2]
for i in range(3):
ax[i].plot(t, [d.xi.S[j].rpy()[i] * 180 / math.pi for d in data], color="C0")
ax[i].plot(t, [xi.S[j].rpy()[i] * 180 / math.pi for xi in est], color="C1")
ax[i].set_xlabel("t")
ax0.set_title("Calibration: Roll")
ax1.set_title("Calibration: Pitch")
ax2.set_title("Calibration: Yaw")
plt.show()Run Equivariant Filter
(1) Load gyroscope and direction measurement data from EqFdata.csv. See formatCSV function for detailed description.
(2) Initialize the covariance, Sigma.
(3) Run the equivariant filter by passing in Sigma, number of calibration states, total number of available sensors, and the csv data to the sim function.
(4) Outputs 3 plots comparing the truth data (blue line) to the filter estimate (orange line.)
# Seed
np.random.seed(0)

# Load dataset
print(f"Loading dataset:\n")
df = pd.read_csv(findExampleDataFile("EqFdata.csv"))
data = formatCSV(df)

# Define initial covariance
Score = blockDiag(np.eye(3), 0.1 * np.eye(3))
Scal = repBlock(np.eye(3), data[0].n_cal)
Sigma = blockDiag(Score, Scal)

# Run filter
filter_args = [Sigma, data[0].n_cal, data[0].n_meas]
sim(filter_args, data)
Loading dataset:
100% |########################################################################|
- Fornasier, A., Ng, Y., Brommer, C., Bohm, C., Mahony, R., & Weiss, S. (2022). Overcoming Bias: Equivariant Filter Design for Biased Attitude Estimation With Online Calibration. IEEE Robotics and Automation Letters, 7(4), 12118–12125. 10.1109/lra.2022.3210867